Rescuing Fleet Management System: From Client Disappointment to Operational Excellence
ST Engineering is a rapidly growing tech company expanding its autonomous fleet operations and remote services. The Fleet Management System (FMS) is a mission-critical dashboard that enables operators to monitor, control, and optimize autonomous fleet operations with minimal human intervention. The platform serves co-pilots who manage 7-9 autonomous vehicles each, system administrators overseeing device connectivity and security, and fleet supervisors ensuring operational performance and approving critical controls.

Role
Lead UX Designer
Duration
3 weeks
Responsibilities
Research, UX UI Designs, handoff to dev, QC
Impact
- 99.95% reduction in fleet health status identification (1 week to 5 minutes)
- 96% reduction in fleet event creation time (1 day to 3 hours)
- 50% task completion rated “easy, no trouble” in usability testing with 15 operators
- Contract saved, restored client confidence and secured Phase 2 funding
THE PROBLEM
When Half The Timeline is Already Gone
I joined this project at what most designers would call the worst possible moment – more than half the timeline had elapsed, the client had just expressed serious disappointment with the proposed platform, and the contract was on the line. ST Engineering needed a dashboard for their autonomous fleet operations, but what had been delivered by the front-end development team wasn’t meeting expectations.
The high-stakes situation
The client’s feedback was clear, the platform lacked user intuitiveness, felt disconnected from operational reality, and didn’t reflect the sophistication of the autonomous technology it was meant to control. With only 1.5 weeks remaining in a 3-week timeline, ST Engineering’s credibility and contract continuation were at risk.
Why the project was failing
The original approach treated this as a straightforward data display challenge. Front-end developers, familiar with the design system, assumed they could execute the interface without UX expertise. But autonomous fleet management isn’t just about showing data, it’s about creating an intuitive control experience that gives operators confidence in systems operating with minimal human intervention.
What operators actually needed was a gamified, highly interactive interface that made complex autonomous operations feel approachable and controllable. The developer-led design missed this entirely.
The operational crisis before the dashboard
Before any centralized system existed, fleet operations were held together by disconnected tools, Excel spreadsheets, and manual processes:
- Fleet health monitoring took 1 week – operators had to physically check each autonomous vehicle one by one to determine operational status
- No task completion visibility – teams had no way to know if programmed tasks were executed unless they physically inspected vehicles
- Training took 2+ months – new co-pilots needed extensive time to familiarize themselves with scattered data logging across multiple disconnected systems
- Manual error-prone logging – all operational data was recorded manually, leading to frequent human errors and data loss
- Reactive problem-solving only – issues were discovered through weekly physical inspections, not proactive monitoring
With 7 co-pilots each managing 7-9 autonomous fleets, this operational model simply couldn’t scale.
What Success Would Look Like
Transform the developer-led interface into an intuitive, operator-centered dashboard that enables real-time fleet monitoring, task management, and control – all while meeting aggressive timeline constraints and rebuilding client trust.
Success Metrics
Operators must be able to view all fleet statuses at a glance, quickly identify health issues, create and modify tasks efficiently, and feel confident controlling autonomous vehicles remotely. The platform needed to be accessible, scalable, and launch-ready within 1.5 weeks.
MY APPROACH
Joining a Project in Crisis Mode
With no time for traditional discovery, I had to rapidly assess what went wrong and chart a path forward. My approach combined forensic analysis of the existing design with accelerated user research to rebuild the foundation.
My rescue strategy
Design Review First: Before defining research goals, I audited the developer-created interface to understand what the client had seen. The review revealed critical gaps:
Dashboard Review

Fleet cockpit review

Project Task review

Similarly, about 30+ UI screens and user journey was reviewed and identified umpteen gaps that makes the platform unusable or sellable to the demanding market. Testing revealed a structural problem beyond individual screens – the IA didn’t match operator mental models.
The inherited problem: The developer design organized navigation around system features (Events, Staging, Settings) rather than workflows, forcing operators to translate tasks into technical categories.
- Task flows were incomplete or confusing
- Navigation didn’t match operator mental models
- No consideration for new-user onboarding (despite the entire team being recent hires)
- Missing functionality for day-to-day operations
- Non-gamified approach that felt clinical and disconnected from the sophisticated autonomous technology
Rapid Research Approach
- Stakeholder Alignment Sessions: Worked with project manager and stakeholders to extract pain points, aspirations, gaps, opportunities, and daily workflows that should have been documented from the start
- Operator Interviews: Conducted 7 interviews with 5 fleet co-pilots and 2 system administrators, focusing on current pain points and operational workflows
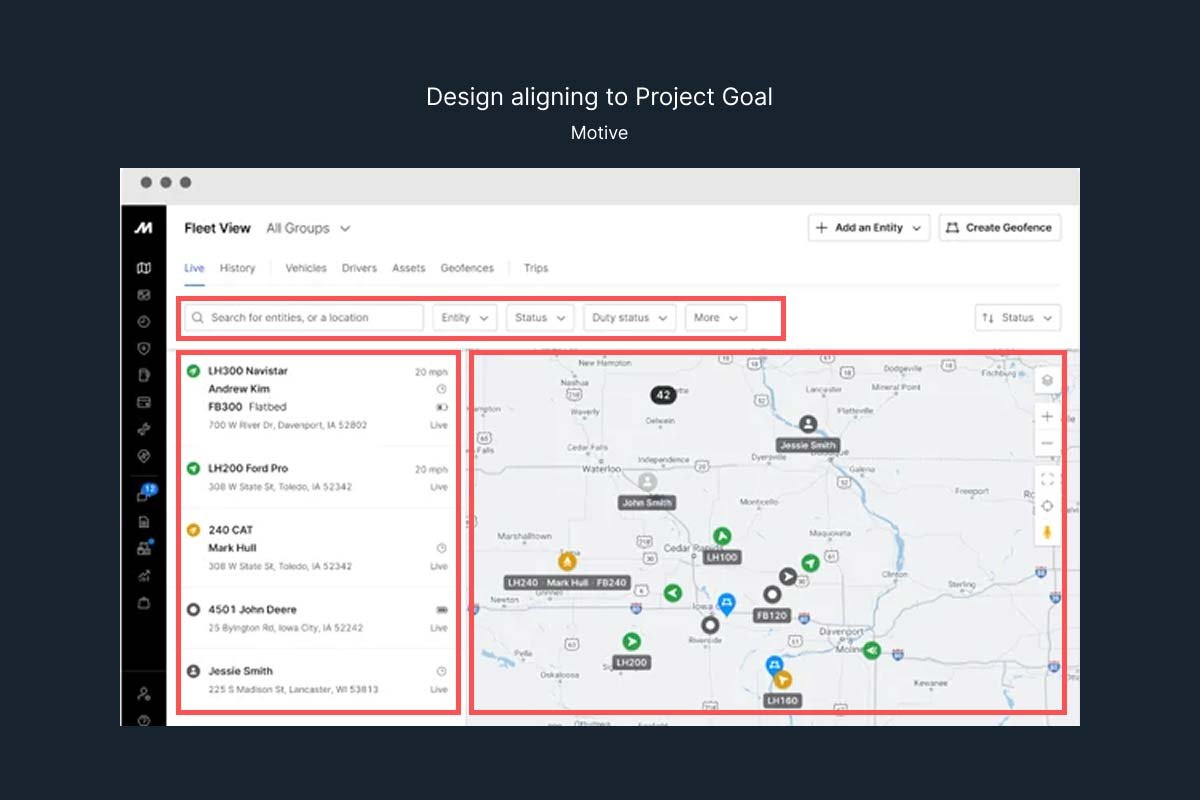
- Competitive Analysis: Reviewed Samsara, Motive, and Azuga Fleet platforms – Motive’s approach aligned best with our direction
- Focus Group Workshops: Ran collaborative sessions with operators to prioritize features for the first release and validate assumptions

From Samsara
✅ Single centralized dashboard philosophy
✅ Multi-channel alert system
✅ AI-powered event detection to reduce cognitive load
From Motive: ⭐ Primary Inspiration
✅ Gamified interaction patterns (THE critical insight)
✅ Role-based customization for different user types
✅ Balance of monitoring + active control
✅ Sophisticated visual feedback systems
✅ Time-based replay interactions
From Azuga
✅ Tile-based modular organization
✅ Positive reinforcement over punitive monitoring
✅ Simplicity and ease of learning
Research Goals
- Understand daily workflows and pain points of co-pilots and system administrators
- Identify critical tasks that must work in the first release (no room for errors)
- Capture new hire perspectives to address onboarding challenges
- Validate stakeholder assumptions against real operator needs
- Ruthlessly prioritize what could be delivered in 1.5 weeks
Why I skipped traditional deliverables: No time for personas, detailed journey maps, or low-fidelity wireframes. I went straight to high-fidelity prototypes using the existing design system, annotating design rationale for stakeholders and developers. Speed and clarity were the priority.
What the Research Revealed
Despite the compressed timeline, clear patterns emerged from operator interviews and empathy mapping:


1. Operators Needed System-Wide Visibility, Not Detailed Drill-Downs
Co-pilots managing 7-9 autonomous vehicles simultaneously couldn’t afford to navigate deep into individual fleet views to check basic status. They needed a dashboard that showed everything at once – fleet health, battery levels, task status, and location – in a single glance.
The developer design required multiple clicks to see basic information. Operators described feeling blind to their own fleet operations.
2. Gamified Controls Build Confidence in Autonomous Systems
Operators weren’t just monitoring data – they were supervising autonomous vehicles and occasionally needed to take manual control. The interface needed to feel like a sophisticated control system, not a data table.
Specific needs included:
- Visual status indicators showing fleet health, power, and task execution in real-time
- Quick action controls (pause tasks, switch physical lights, override to manual control)
- 360° camera views for visual confirmation during manual operations
- Interactive controls that felt responsive and gave clear feedback
3. The AI Library Was Underutilized
Fleets captured images continuously using AI for object detection and classification. But the existing “photo library” was just a chronological list with no search, no filtering, no cross-referencing. Operators wanted to search for specific objects across specific timeframes and match current detections with historical records.
From Insights to Design Principles:
These findings led to three guiding principles:
- Clarity at a Glance: Fleet data must be instantly understandable without navigation
- Gamified Interaction: Controls should feel sophisticated and responsive, building operator confidence in autonomous systems
- Accessible Scalability: New hires should grasp the platform quickly, and the architecture must support future features without rework
THE SOLUTION
Rebuilding the Foundation Under Time Pressure
With only 1.5 weeks to redesign and validate, I had to make strategic decisions about what to keep, what to cut, and what to rebuild from scratch.
What the Research Revealed
The front-end development team was understandably lost and confused when I joined. They’d been working independently and suddenly a UX designer was brought in to redirect the project. There was no time for political maneuvering – I had to establish clear leadership quickly.
My approach: Collaborative transparency. I involved the development team in design reviews, explained rationale for every decision, and showed how user research validated the new direction. By making the process visible and collaborative, I turned potential resistance into partnership.
Rebuilding the Navigation Foundation
Before diving into visual design, I needed to fix the foundational structure. The developer-led navigation was organized around system features rather than operator workflows. A technical architecture that forced users to mentally translate their tasks into system categories.
The inherited IA problem:
The original navigation reflected how the system was built, not how operators work:
-
- Separate “Events” and “Staging” sections (operators think about tasks holistically)
- Quick controls buried in submenus (operators need instant access)
- System health mixed with operational monitoring (different mental models for admins vs co-pilots)
- Map view isolated from fleet status (operators need integrated context)

The restructure: I reorganized around how co-pilots actually think:
- Dashboard – Overview all fleets with quick controls elevated to top level
- Fleet Cockpit – Individual fleet supervision with manual controls
- Task Center – Unified events and staging (operators think holistically about tasks)
- AI Intelligence – Advanced filtered library replacing basic photo storage
- System Admin – Technical system management separated from operations
Key principle: Navigation should mirror operator workflows, not system architecture. This foundation proved critical for Phase 2: new features could be added without disrupting the established mental model.
UI Design Sandbox
With the Gamification approach, UI designs from widget & layout levels needed to be reviewed and redesigned. This helps to set the user-behaviour patterns while also lessening the cognitive load of users. This also helped to optimise the space for display other viable details and features.

Critical Design Decisions
With the Gamification approach, the overall UI designs needed to be reviewed and redesigned. This helps to set the user-behaviour patterns while also lessening the cognitive load of users.
Decision 1: Dashboard-First Homepage

View in Figma
What changed: I added a comprehensive dashboard as the login/home page that operators see immediately upon accessing the platform.
Why it mattered: The developer design treated the homepage as a navigation hub to access different features. But operators needed to see all fleets simultaneously – health status, battery levels, task execution, and map positions – without clicking anywhere.
Key controls included:
- Pause/resume fleet tasks
- Switch physical lights on/off remotely
- Override autopilot to manual control
- Filter fleets by operational status
Alternative considered: The front-end approach used a similar layout but wasn’t optimized. The map didn’t cluster fleet positions effectively, didn’t use unique icons to represent different fleet types, and lacked quick-action buttons. I redesigned the entire visual hierarchy and interaction model.
Decision 2: AI Library with Advanced Filtering

View in Figma
What changed: Transformed a simple chronological photo library into a searchable, filterable intelligence system.
Why it mattered: Operators requested a photo library, but I recognized this was about operational intelligence, not just storage. The platform’s AI captured and classified objects continuously – this data needed to be actionable.
Features added:
- Filter by object category (person, vehicle, hazard, etc.)
- Search by date and time range
- Cross-reference current detections with historical records
- Quick access to specific fleet captures
Rationale: This elevated the AI library from documentation to decision-making tool, allowing operators to investigate incidents, verify task execution, and identify patterns.
Decision 3: Gamified Status Indicators and Controls

View in Figma
What changed: Designed visual status indicators that clearly communicate fleet health, power, and task status using color, iconography, and real-time animation.
Why it mattered: Operating autonomous vehicles remotely requires confidence. Gamified UI patterns – similar to those in sophisticated control systems and simulation games – create visceral feedback that builds operator trust.
Specific implementations:
- Health status indicators with clear visual hierarchy
- Real-time task execution progress bars
- 360° camera view for manual override operations
- Manual camera position controls
- LiDAR visualization showing scanned environment and planned paths
Alternative considered: The developer approach used basic tables and text labels. This felt clinical and disconnected from the sophisticated autonomous technology. I advocated for an interface that matched the innovation of the hardware.
KEY OUTCOMES
Testing, Learning & Refining
With only days remaining, I conducted aggressive usability testing with 15 operators across 10 critical tasks:

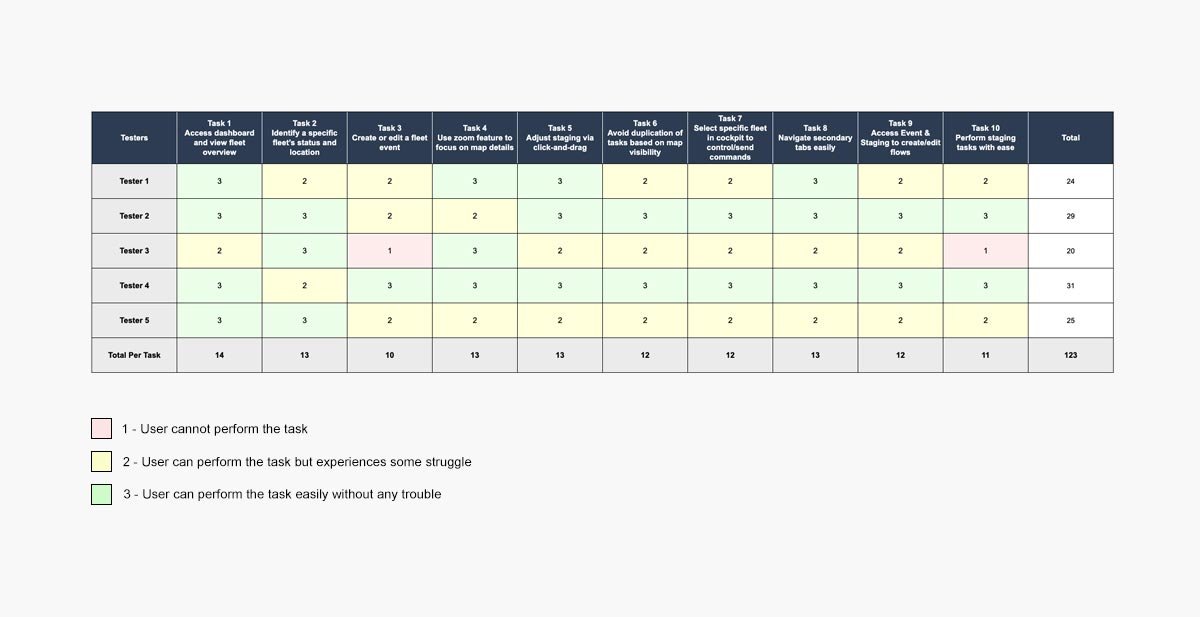
Test Scenarios:
- Access dashboard and view fleet overview
- Identify specific fleet status and location
- Create and edit fleet event
- Use zoom feature to focus on map details
- Adjust staging via click and drag
- Avoid task duplication based on map visibility
- Select specific fleet in cockpit to send commands
- Navigate secondary tabs easily
- Access event and staging to create/edit task flows
- Perform staging tasks with ease
Results
- 50% of tasks rated “3” (easy, no trouble)
- 46% of tasks rated “2” (some struggle)
- 4% of tasks rated “1” (cannot perform)
Critical issues identified: Two high-priority usability problems emerged related to creating/editing fleet events and staging (chained task sequences). Both were resolved before launch.
The Turnaround: From Disappointment to Confidence
I tracked impact both during testing and post-launch validation with actual operators in production.
Key Metrics

Task Completion Success
- 50% of operators completed tasks easily without trouble
- 46% completed tasks with some struggle (acceptable for first release)
- 4% could not complete tasks (addressed in post-launch updates)
User Satisfaction
The client’s feedback post-redesign: “The platform’s user-intuitiveness increased tremendously, and the gamified approach made it easier to grasp and explore.”
Operators particularly valued:
- Single-glance fleet overview eliminating constant navigation
- Quick action controls for common operations (pause, lights, manual override)
- AI library filtering that turned raw data into actionable intelligence
- Visual confidence in autonomous operations through gamified status indicators
Business Impact
Contract saved: The redesign restored ST Engineering’s confidence in our delivery capability and credibility, securing continued partnership.
Phase 2 approved: The client greenlit a second phase for the following year, wanting to explore additional features. The new design’s scalable architecture made future enhancements efficient rather than requiring rework.
Operational scalability unlocked: With 7 co-pilots managing 7-9 autonomous fleets each, the new dashboard eliminated the bottleneck of manual checks and enabled the team to scale operations.
Cross-functional collaboration model: The rapid turnaround demonstrated effective partnership between UX, development, and stakeholders under pressure – a model that influenced future projects.
What We Could Have Done Better
More comprehensive testing: With only 15 operators in usability testing, we missed some edge cases that surfaced post-launch. A larger sample would have caught these earlier.
Deeper hardware-software integration research: While I understood the autonomous fleet technology at a high level, more time learning the hardware systems and how they translate to software controls would have improved some interaction patterns.
Lo-fi iteration: Going straight to high-fidelity was necessary given time constraints, but it meant we couldn’t test as many alternative approaches before committing to a design direction.
Documentation handoff: The rushed timeline meant some design rationale wasn’t documented as thoroughly as it should have been for the Phase 2 team. I’ve since learned to document continuously, even under time pressure.
CHALLENGES & LEARNINGS

What This Project Taught Me
If I could redo this project:
1. Demand proper documentation during onboarding
Joining without documentation forced me to reverse-engineer requirements on the fly. Now I explicitly ask for project context, prior decisions, and stakeholder alignment documentation even if it means delaying my start by a day or two to review properly.
2. Build in validation checkpoints, even under time pressure
The aggressive timeline meant I sometimes made design decisions based on rapid validation rather than deep confidence. Now I identify 2-3 critical decisions that must have strong validation and protect time for those, even if it means cutting scope elsewhere.
3. Create a risk mitigation plan upfront
I should have explicitly discussed with stakeholders what wouldn’t be perfect in the first release and how we’d address it in Phase 2. This sets expectations and prevents surprises.
Lessons I’m Carrying Forward:
1. Rescue projects require ruthless prioritization: When half your timeline is gone, you can’t do everything. I learned to identify the 3-5 highest-impact design decisions and focus all energy there, accepting that some things won’t be optimal. Perfection is the enemy of good enough under time constraints.
2. Gamification isn’t about fun – it’s about confidence: The gamified approach worked because it matched the sophistication of the autonomous technology. Operators needed to feel in control of advanced systems. Now I think about interface tone and visual language as tools for building user confidence, especially in high-stakes technical environments.
3. Politics doesn’t exist when stakes are high enough: The front-end team could have been defensive when I joined, but the contract pressure aligned everyone toward the same goal. I’ve learned that transparent collaboration and clear rationale dissolve resistance faster than political maneuvering.
4. Speed forces clarity: The compressed timeline meant I couldn’t hide behind process. Every decision needed clear justification. This taught me to always be able to answer “why” in two sentences or less, regardless of project timeline.
Final Thoughts

Looking back on this project, three core UX principles shaped everything we built – and continue to influence how I approach high-pressure rescue situations.
Operators needed confidence, not just information. I came into this project expecting to improve data visualization and navigation. What I learned was that autonomous fleet operations require a different kind of interface – one that builds visceral trust through gamified interactions and real-time feedback. The 360° camera views, status indicators, and manual override controls weren’t just features, they were confidence-building mechanisms that helped operators trust systems operating with minimal human intervention. This taught me to look beyond functional requirements to understand the emotional relationship users need with technology.
Time pressure clarifies what actually matters. With only 1.5 weeks to redesign and launch, I couldn’t afford to optimize everything. I had to identify the highest-impact decisions and focus there ruthlessly. The dashboard-first homepage and AI library filtering were those decisions. Everything else was good enough. This experience changed how I approach all projects now – even with ample time, I ask “what are the 3 decisions that matter most?” and protect time for those.
Rescue missions require leadership, not just design skills. When I joined, the team was lost and the client had lost confidence. Technical design skills weren’t enough – I had to establish direction, build trust across the team, and make rapid decisions with incomplete information. The ability to say “here’s what we’re doing and why” with clarity and confidence turned out to be as important as the actual design work. This project taught me that senior designers lead through clarity, especially when everyone else is uncertain.
This project reminded me that UX design isn’t just about making interfaces intuitive – it’s about solving real business problems under real constraints. The FMS dashboard now helps co-pilots manage autonomous fleets efficiently, reduces operational delays from weeks to minutes, and gives ST Engineering a foundation for scaling their autonomous operations. That impact, achieved under extreme time pressure, makes this one of the most challenging and rewarding projects of my career.
Let’s Connect